It’s been a hard year, things haven’t really gone as planned. With a long weekend ahead of me, I wanted to get back to doing open source contributions. I generally prefer contributing to tools that I use on a daily basis. In the past, this has included git, docker, linux, and so on. Recently I’ve been mostly working on go, this means one of the tools I used the most has been gopls (see what I did there with the title?). Before we talk about gopls, it’s a good idea to talk about LSP!
Language Server Protocol (LSP) Link to heading
Modern IDEs provide developers with sophisticated features like code completion, refactoring, navigating to a symbol’s definition, syntax highlighting, and error and warning markers.
The general problem is that IDEs and text editors have to provide these functionalities. So, each IDE implements its own solution to solve this. Given that every programming language has its own complexities, the solutions are generally language-specific. This means that more often than not, IDEs have to spend resources tackling the same problem.
The solution lies in abstraction. If we could have common tools which provide these solutions and IDEs could interface with, IDEs would no longer need to implement this themselves and could just rely on these tools, while focusing on presentation and user interaction. Language Server Protocol is the protocol that was defined by Microsoft to do exactly that.
While LSP was initially drafted to be specific to vscode, it is now commonly accepted and implemented across most IDEs and text editors. For e.g. I use LSP with emacs via the lsp-mode package. This also means that users can now expect similar functionality across various IDEs as long as they’re using the same language server.
Gopls Link to heading
gopls(pronounced “Go please”) is the official Go language server developed by the Go team. It provides IDE features to any LSP-compatible editor.
Since it’s an official tool, it has gained a lot of traction since its creation and is now the default backend for when you use go with vscode. I have been wanting to poke around and see how it’s implemented, but never got around to it. So this weekend, I thought I’d pick up a gopls issue from Github and try my best to resolve/implement it.
Finding an Issue Link to heading
When you need to contribute to a popular open-source project, it’s always a wise idea to look for their contribution guidelines. The maintainers usually put in their thoughts on how you can get started with the project. With gopls, the contribution guide states that we can claim issues tagged with gopls in the go GitHub repository.
Although the code for gopls lies in golang/tools, the issues are raised on golang/go
I looked around the issues and found some with the help wanted label. I finally zeroed down on https://github.com/golang/go/issues/43438. The issue seemed like it was easy enough for someone new to the repository while being hard enough to keep me engaged.
Include function literals as outgoing call hierarchy calls Link to heading
Let’s discuss the issue first, before diving into the solution. From the issue we have:
|
|
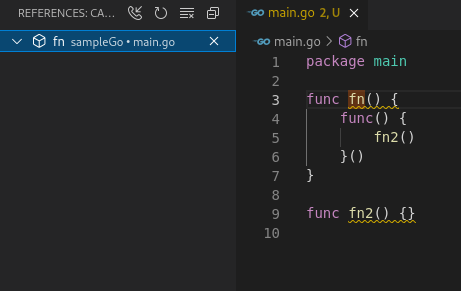
As the author mentions, if we request the outgoing function calls for fn() it should list fn2(), as it’s called within the function literal. But gopls doesn’t recognize this and returns none when we ask for outgoing functions.
Reproducing the issue Link to heading
Let’s reproduce the issue first, let’s copy the code into a file, and then check the call hierarchy. You can see that there are no calls shown in the outgoing call hierarchy.
Now to understand what is happening behind the scenes, we can enable the tracing of communication between vscode and gopls. We can do so by searching for the Trace: Server setting in vscode under the go extension and enabling the verbose mode. After doing so, we can now see the exchange of data from/to gopls in the output console of vscode.
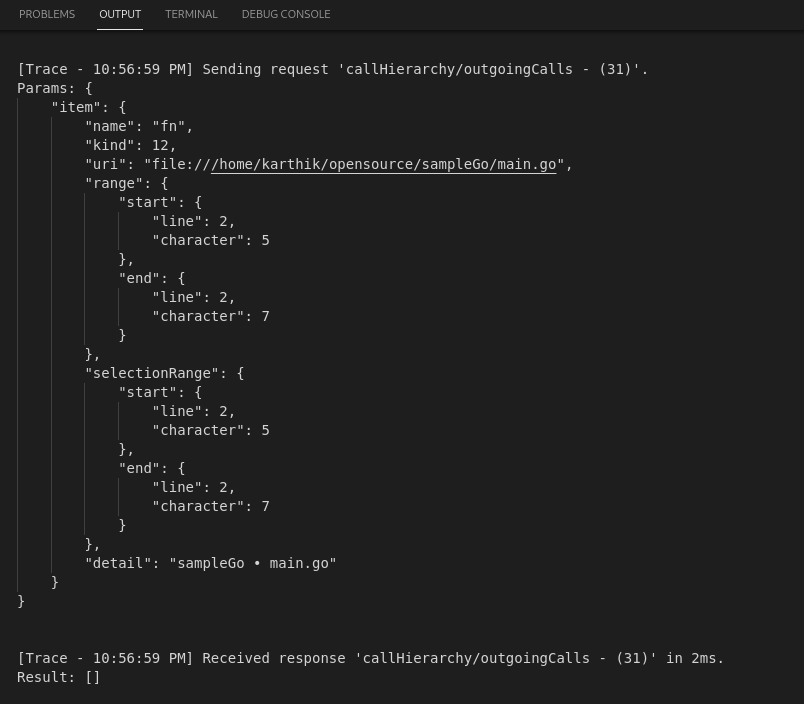
Notice how the Received response is returning an empty array. This is what we need to fix! ;D
Navigating the code Link to heading
Now let’s try and locate the code responsible for outgoing calls. Let’s start by cloning the golang/tools repository. While the code for gopls lies in the gopls folder, this is only the entry point and tests. Most of the internal code is present inside ofinternal/lsp
A quick search for outgoingcalls within the repository took me directly to internal/lsp/source/call_hierarchy.go. This looks like the code we’d want to modify. Let’s go over it!
|
|
While we don’t know the entirety of the code, we can make some assumptions based on the variables and function names. Most of the functions are also documented, so that helps a lot. But there is a more dynamic approach that I like to take in such cases, which is to use a debugger and walk through the code. This helps us in the following ways:
- Lets us see the data dynamically
- See changes made to the data in real-time and map the code to the data
- Makes it easier to understand where is the core logic which we’d need to focus on
Debugging Link to heading
To start off we want to rebuild the gopls installation to ensure it has all the debug symbols attached, this is generally stripped when creating the binary. We can do so by:
# Relative to the location where go/tools is cloned
cd gopls
go build -o gopls -gcflags="all=-N -l" main.go
mv gopls $GOPATH/bin/
Make sure to restart the language server in vscode so that it uses the new binary.
We’ll be using delve to perform the debugging. To start off, let’s obtain the PID of the running gopls server.
❯ ps aux | grep gopls
karthik    16157  0.4  0.1 2201020 27608 ?       Sl   12:38   0:00 /home/karthik/go/bin/gopls -mode=stdio
karthik    16397  0.0  0.0   6400  2396 pts/1    R+   12:39   0:00 grep --color=auto gopls
Now we need to start and attach delve to the PID 16157 and add a breakpoint to the function OutgoingCalls. We can do that as follows:
❯ dlv attach 16157
Type 'help' for list of commands.
(dlv) b golang.org/x/tools/internal/lsp/source.OutgoingCalls
Breakpoint 1 (enabled) set at 0x7f5a58 for golang.org/x/tools/internal/lsp/source.OutgoingCalls() /home/karthik/go/pkg/mod/golang.org/x/[email protected]/internal/lsp/source/call_hierarchy.go:181
(dlv) c
Do notice, the last c (continue) is to start the debugger. Now when we request outgoing calls from vscode we’ll be stopped at the debug point.
> golang.org/x/tools/internal/lsp/source.OutgoingCalls() /home/karthik/go/pkg/mod/golang.org/x/tools@v0.1.1-0.20210504170620-03ebc2c9fca8/internal/lsp/source/call_hierarchy.go:181 (hits goroutine(324):1 total:2) (PC: 0x7f5a58)
Warning: debugging optimized function
   176:			SelectionRange: rng,
   177:		}, nil
   178:	}
   179:
   180:	// OutgoingCalls returns an array of CallHierarchyOutgoingCall for a file and the position within the file.
=> 181:	func OutgoingCalls(ctx context.Context, snapshot Snapshot, fh FileHandle, pos protocol.Position) ([]protocol.CallHierarchyOutgoingCall, error) {
   182:		ctx, done := event.Start(ctx, "source.OutgoingCalls")
   183:		defer done()
   184:
   185:		identifier, err := Identifier(ctx, snapshot, fh, pos)
   186:		if err != nil
We can now use n (next) to Step over to next source line and s (step) to Single step through program as required. Let’s go line by line.
Line 183-184 Link to heading
|
|
Here we’re just starting an event to trace the functionality being performed, this is more for telemetry and shouldn’t influence the logic as such. Let’s move along using n via dlv.
Line 186-192 Link to heading
|
|
From the names used, we can see that this is the part where we get the identifier for the code we’re trying to get the outgoing calls on. This could mean translation from the incoming request which we saw in the log before to an internal structure that is more easily understandable. We can skip this too.
Line 192-204 Link to heading
There seem to be 3 checks, for which we can get no outgoing calls. Let’s tackle them:
L194 Link to heading
|
|
Here we check if the request is made on a function/method, otherwise, we can exit early.
L197 Link to heading
|
|
This is a scenario where having the debugger really helps. We’re not sure what this check is for, so let’s see what the data holds
(dlv) p identifier.Declaration.node
go/ast.Node(*go/ast.FuncDecl) *{
	Doc: *go/ast.CommentGroup nil,
	Recv: *go/ast.FieldList nil,
	Name: *go/ast.Ident {
		NamePos: 221,
		Name: "fn",
		Obj: *(*"go/ast.Object")(0xc00013c190),},
	Type: *go/ast.FuncType {
		Func: 216,
		Params: *(*"go/ast.FieldList")(0xc00070cea0),
		Results: *go/ast.FieldList nil,},
	Body: *go/ast.BlockStmt {
		Lbrace: 226,
		List: []go/ast.Stmt len: 1, cap: 1, [
			...,
		],
		Rbrace: 251,},}
Ah, this seems to be the AST data. We can see that LSP internally uses an AST and then traverses through that AST to perform operations. This means in our case it’s probably not traversing through the AST for function literals. This is useful information we’ll need to keep in mind.
Coming back to this particular check, it seems to see if the AST is present or not. Not entirely sure when this would be nil, but I guess we don’t have to worry about it for our use case.
L200 Link to heading
|
|
Here we probably are checking for the source code this is mapped to, an immediate question is why is it checking for length? Can there be more than one range for a function? This is put to rest by the code in 185. Where we take the 0th MappedRange. We can also confirm that only one mapped range exists from our debugger:
(dlv) p identifier.Declaration.MappedRange
[]golang.org/x/tools/internal/lsp/source.MappedRange len: 1, cap: 1, [
	{
		spanRange: (*"golang.org/x/tools/internal/span.Range")(0xc0001fe040),
		m: *(*"golang.org/x/tools/internal/lsp/protocol.ColumnMapper")(0xc00070d140),
		protocolRange: *golang.org/x/tools/internal/lsp/protocol.Range nil,},
]
collectCallExpressions Link to heading
Next, we call collectCallExpressions, from the documentation, this seems to hold the crux of the logic regarding getting the outgoing calls.
|
|
It’s a little complicated to understand. So let’s first understand the ast.Inspect and what it’s supposed to do. From the documentation we have
// Inspect traverses an AST in depth-first order: It starts by calling
// f(node); node must not be nil. If f returns true, Inspect invokes f
// recursively for each of the non-nil children of node, followed by a
// call of f(nil).
//
func Inspect(node Node, f func(Node) bool) {
	Walk(inspector(f), node)
}
Right, so this is the part of the code which traverses the AST and calls a function (callback) for each node in the AST traversal. If we return True it will continue traversing that node. Now looking at lines 213-216 of the function, it seems that this is the array to contain the result, i.e. all the outgoing calls. Let’s now add a breakpoint on line 219 so that we can traverse through the AST and follow along.
(dlv) b 219
Breakpoint 2 (enabled) set at 0x83d325 for golang.org/x/tools/internal/lsp/source.collectCallExpressions.func1() /home/karthik/go/pkg/mod/golang.org/x/tools@v0.1.1-0.20210504170620-03ebc2c9fca8/internal/lsp/source/call_hierarchy.go:219
(dlv) c
> golang.org/x/tools/internal/lsp/source.collectCallExpressions.func1() /home/karthik/go/pkg/mod/golang.org/x/tools@v0.1.1-0.20210504170620-03ebc2c9fca8/internal/lsp/source/call_hierarchy.go:219 (hits goroutine(324):1 total:1) (PC: 0x83d325)
Warning: debugging optimized function
   214:			start, end token.Pos
   215:		}
   216:		callPositions := []callPos{}
   217:
   218:		ast.Inspect(node, func(n ast.Node) bool {
=> 219:			if call, ok := n.(*ast.CallExpr); ok {
   220:				var start, end token.Pos
   221:				switch n := call.Fun.(type) {
   222:				case *ast.SelectorExpr:
   223:					start, end = n.Sel.NamePos, call.Lparen
   224:				case *ast.Ident:
The first thing we check if the node we’re currently at is of type ast.CallExpr.
// A CallExpr node represents an expression followed by an argument list.
This makes sense, we only care about function calls and if the node is not, we continue traversing (L233).
We can get some idea about the current node type by printing the node information on the debugger.
(dlv) p n
go/ast.Node(*go/ast.FuncDecl) *{
...
// A FuncDecl node represents a function declaration.
If we keep traversing the AST using delve, this is the tree we’ll be going through (I didn’t traverse the tree through the debugger, but used it to get an idea of what the tree actually looks like without traversing):
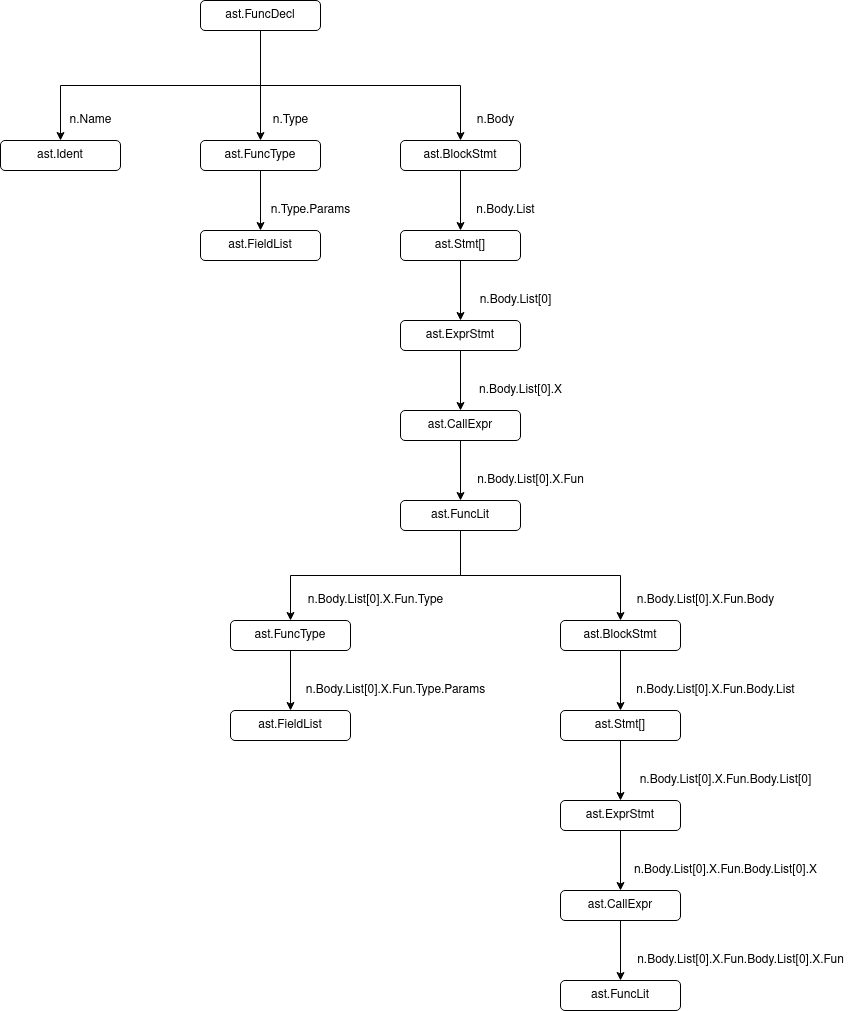
At this point, we can check n.Body.List[0].X.Fun.Body.List[0].X.Fun on the debugger, and we can see that it is indeed fn2, the function we wanted in our outgoing calls.
|
|
Now looking at the code for collectCallExpressions we can see that we’ll pass the check for ast.CallExpr on Line 219. But only ast.SelectorExpr and ast.Ident are considered as outgoing calls while for any other type, we exit the traversal for any other type (by returning false). This leads us directly to our solution.
Solution Link to heading
The solution is simply to ensure that we continue traversal when we encounter a ast.FuncLit type. So effectively:
|
|
While this wouldn’t directly add function literals to the outgoing calls map, it would continue traversal whenever it encounters one. In that traversal, if it finds either a ast.SelectorExpr or ast.Ident it’ll be added to our outgoing function call list.
With this change, let’s rebuild the binary and check.
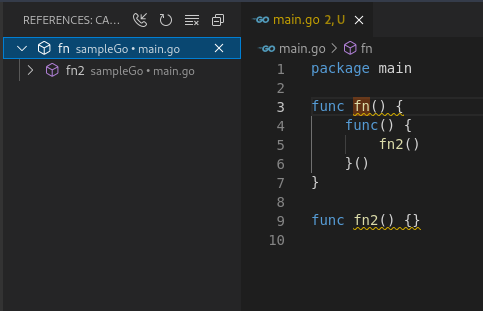
As you can see, now fn2() is printed in our outgoing call list. Success!
Raising a Pull Request Link to heading
With the solution in hand, I went ahead and modified the tests to also check for this particular case. I then created a Pull Request on Github. While the gopls team uses Gerrit for review, they have a bot to create/map all GitHub Pull Requests to Gerrit. Now we wait for the review to take place :)
Will be looking forward to making more contributions to the gopls repository in the coming weeks!
Update: The PR is reviewed by the gopls team and merged! :D