At my current workplace, most of our services are in Go. But we still have a few legacy PHP services. My team currently deals with one of these services. The only PHP knowledge I have is because of working on this service.
One of the things I really like about Go, is the tooling and community around it. These are things we take for granted, but generally make or break a language. Recently while working with PHP I was stuck with a particular integration test which was not performing as I was expecting it to. My first instinct was to run and use the debugger.
Things I know:
- The app runs in docker via docker-compose
- The app has Xdebug version 2 already integrated via the dockerfile
- There is documentation on debugging using vscode (from a Mac perspective)
The documentation Link to heading
The documentation mentions to install the PHP Debug extension for vscode.
Next we add the following debugging configuration to vscode.
|
|
To get an idea of how this works have a look at the following diagram.
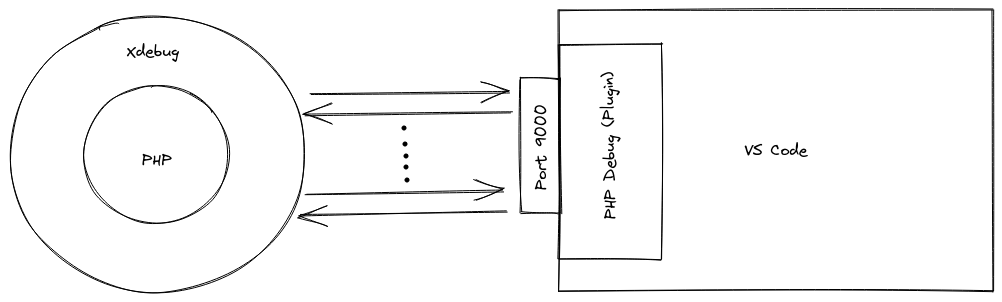
So, in summary, the vscode plugin listens on a particular port for Xdebug (9000 in our case). Xdebug then runs along the PHP app and connects to the plugin via the port mentioned in the configuration. Once the connection between Plugin <> Xdebug is made, they communicate and handle the debugging.
That was simple, but the only problem was this didn’t work. I could add breakpoints but tests would run and finish without stopping.
Debugging Xdebug Link to heading
I was a little clueless onto why this was happening, I couldn’t see anything in the general logs either regarding issues on Xdebug’s side. So putting aside the irony of the situation, I tried to find Xdebug specific logs by connecting to the container via
docker exec -it <container_id> bash
I tried looking inside /var/log/ but found nothing. I then checked for Xdebug configuration and set the following options:
remote_log=/var/log/xdebug.log: Configures a file name to log all Step Debugging connection attempts, failures, and communication.remote_log_level=7: Configures which logging messages should be emitted by the Step Debugging.
Excited to see the logs, I restarted the container (so that it would read the new config) and tried to print the output of /var/log/xdebug.log.
But there was no /var/log/xdebug.log, what gives? ¯\_(ツ)_/¯
Supposedly, Xdebug only writes to the remote_log file, It doesn’t create the file if it doesn’t exist. -_- So this time, I manually created the file (touch /var/log/xdebug.log) and since the container has only one user, I didn’t have to worry about permissions.
Now finally I was able to print the contents of /var/log/xdebug.log
[55] Log opened at 2021-08-29 15:57:58
[55] I: Connecting to configured address/port: docker.for.mac.host.internal:9000.
[55] E: Time-out connecting to client (Waited: 200 ms). :-(
[55] Log closed at 2021-08-29 15:57:58
Interesting…
Docker + Linux Link to heading
The earlier image I showed, didn’t consider the app being run with docker. The Xdebug <> plugin connection in such a scenario is as shown below
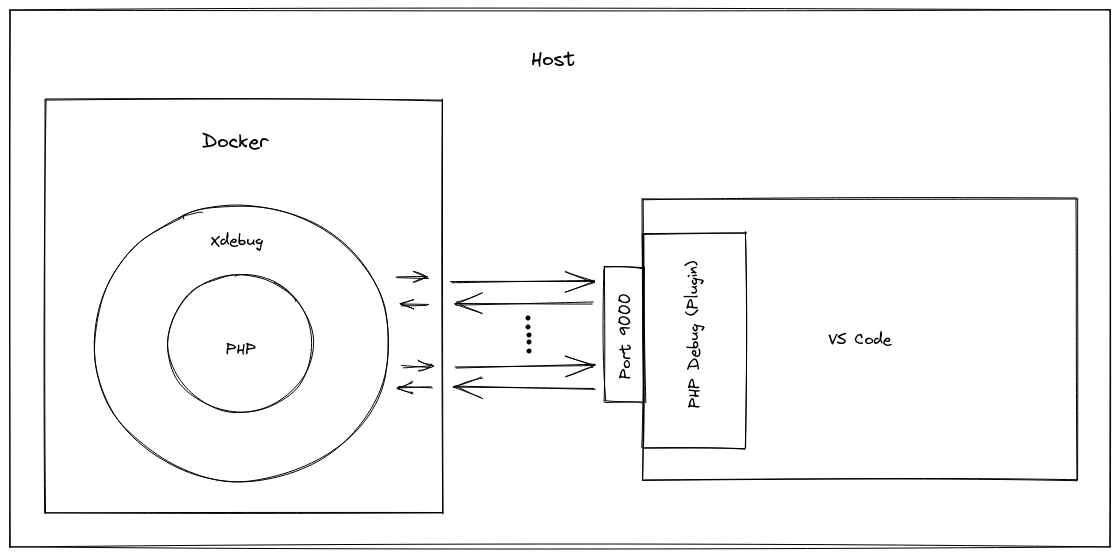
So for this to work, the docker container should be able to connect to the IP (host) of the plugin and Xdebug must know the correct IP of the host within the docker namespace.
For getting the IP of the host within the container, we add the following to our docker-compose.
    extra_hosts:
      - "host.docker.internal:host-gateway"
This maps host.docker.internal to the IP of the host (On Mac machines, this is by default set to host.docker.internal). We can pass this hostname to Xdebug via the configuration XDEBUG_REMOTE_HOST=host.docker.intenal. Xdebug can now resolve the location of the host but it still cannot connect to the host.
This is because on Linux the firewall prevents the connection since the docker interface has a different IP. So we need to allow incoming connection from the docker container towards port 9000.
To get the IP of the docker container we can run cat /etc/hosts within the docker container. We can find the IP of the container there (there are other ways to get the IP from the host machine too). Using this IP we can create a rule in the firewall to allow Xdebug to connect to the plugin as follows:
sudo ufw allow in from <IP> to any port 9000 comment xDebug9000
With this I got Xdebug working on docker on a linux host machine! :)